
To view this content in our official product documentation, click here.
Introduction
Having deployed a remote MCP server, you can browse, inspect and run deployed tools from your MCP servers page - think of it like a control panel for trying out each tool before switching to your AI assistant.
Need to know
- You can browse and run tools for a
deployedMCP server (not for adraft). - Running tools for your
deployedMCP server here will produce the same results as running in a connected AI assistant (retrieving your the API key and running through same endpoints)- if it works here, it will work there.\ \ (grabbing the API key and running through same endpoints) so if a test works, it will work in the client - Running tools here decrements your current Patchworks MCP allowance.
- Running tools here has no impact on the AI allowance associated with connected AI assistants.
The steps
{% stepper %} {% step %} Access your MCP server deployments
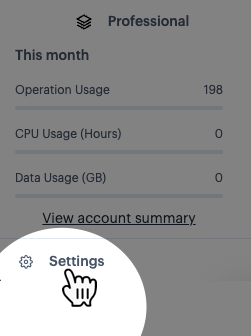
Select the settings option (at the bottom of the navigation menu):
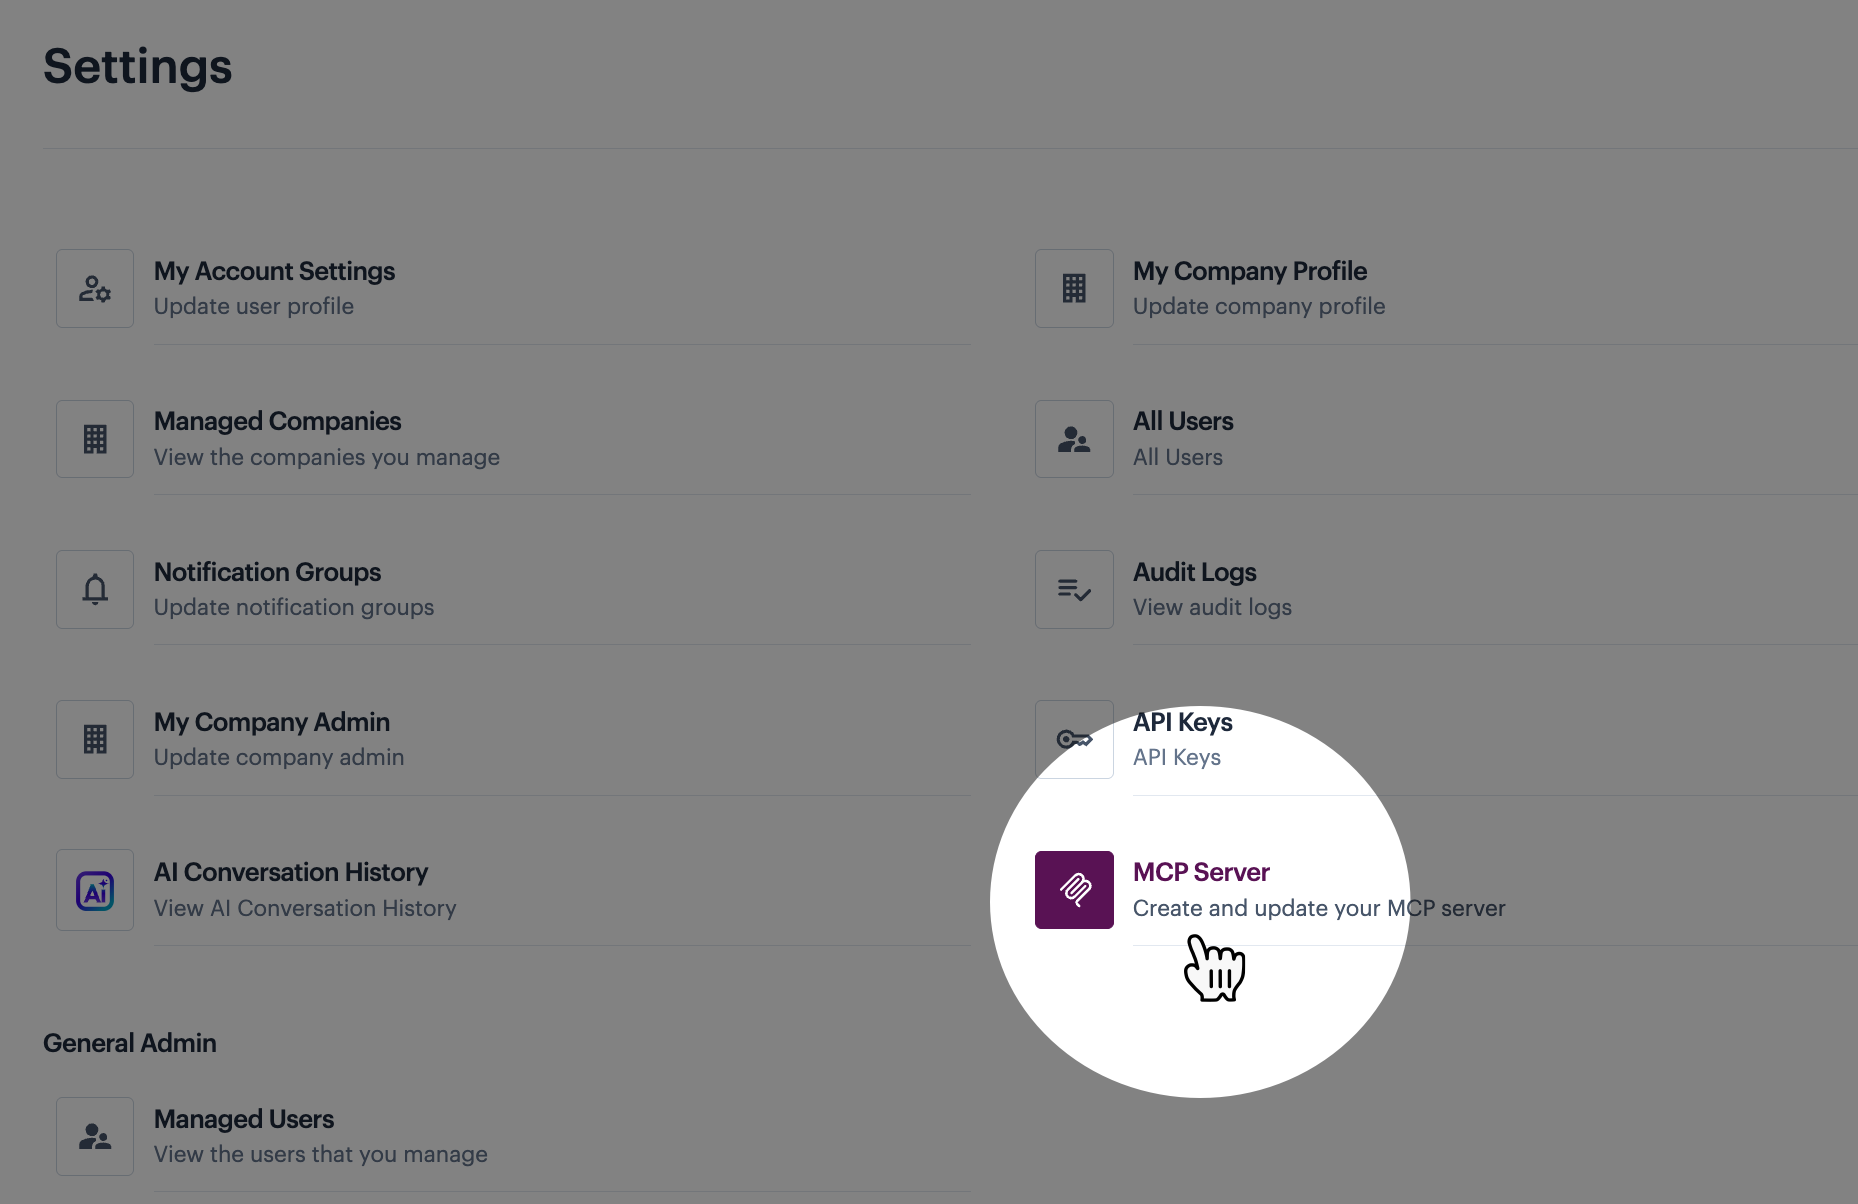
Then select the MCP servers option:
{% endstep %}
{% step %} Access options for your server deployment
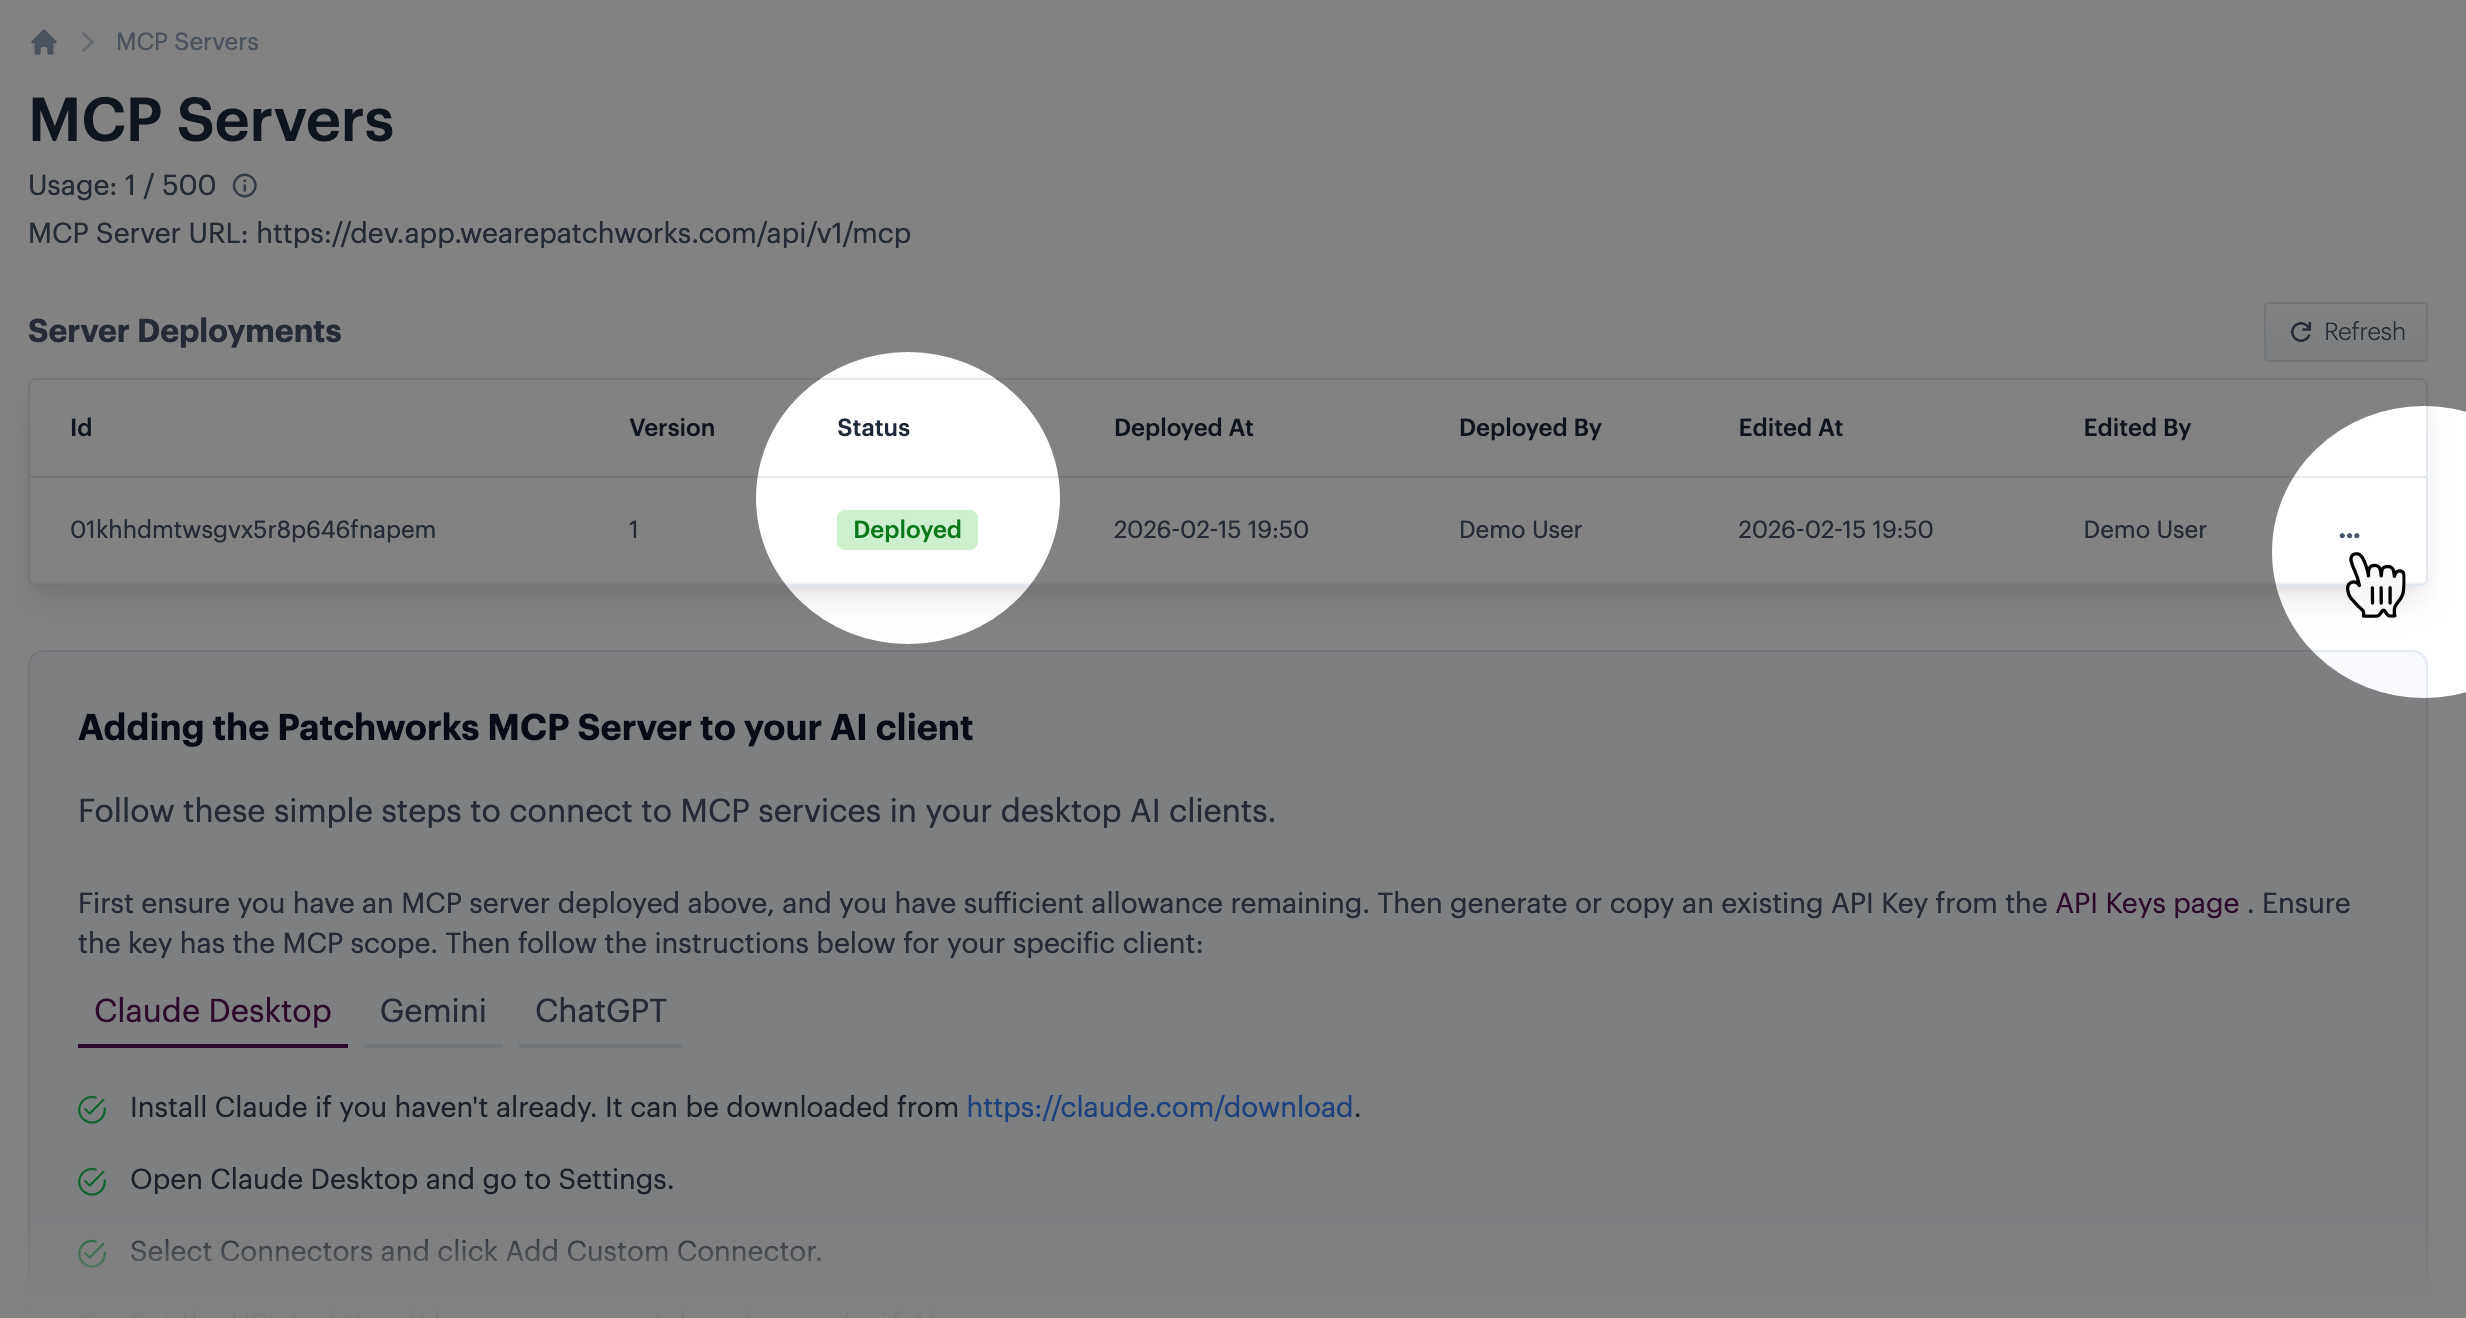
Look for the deployed server and click the associated ellipsis icon. For example:
{% endstep %}
{% step %} Choose to view deployment details
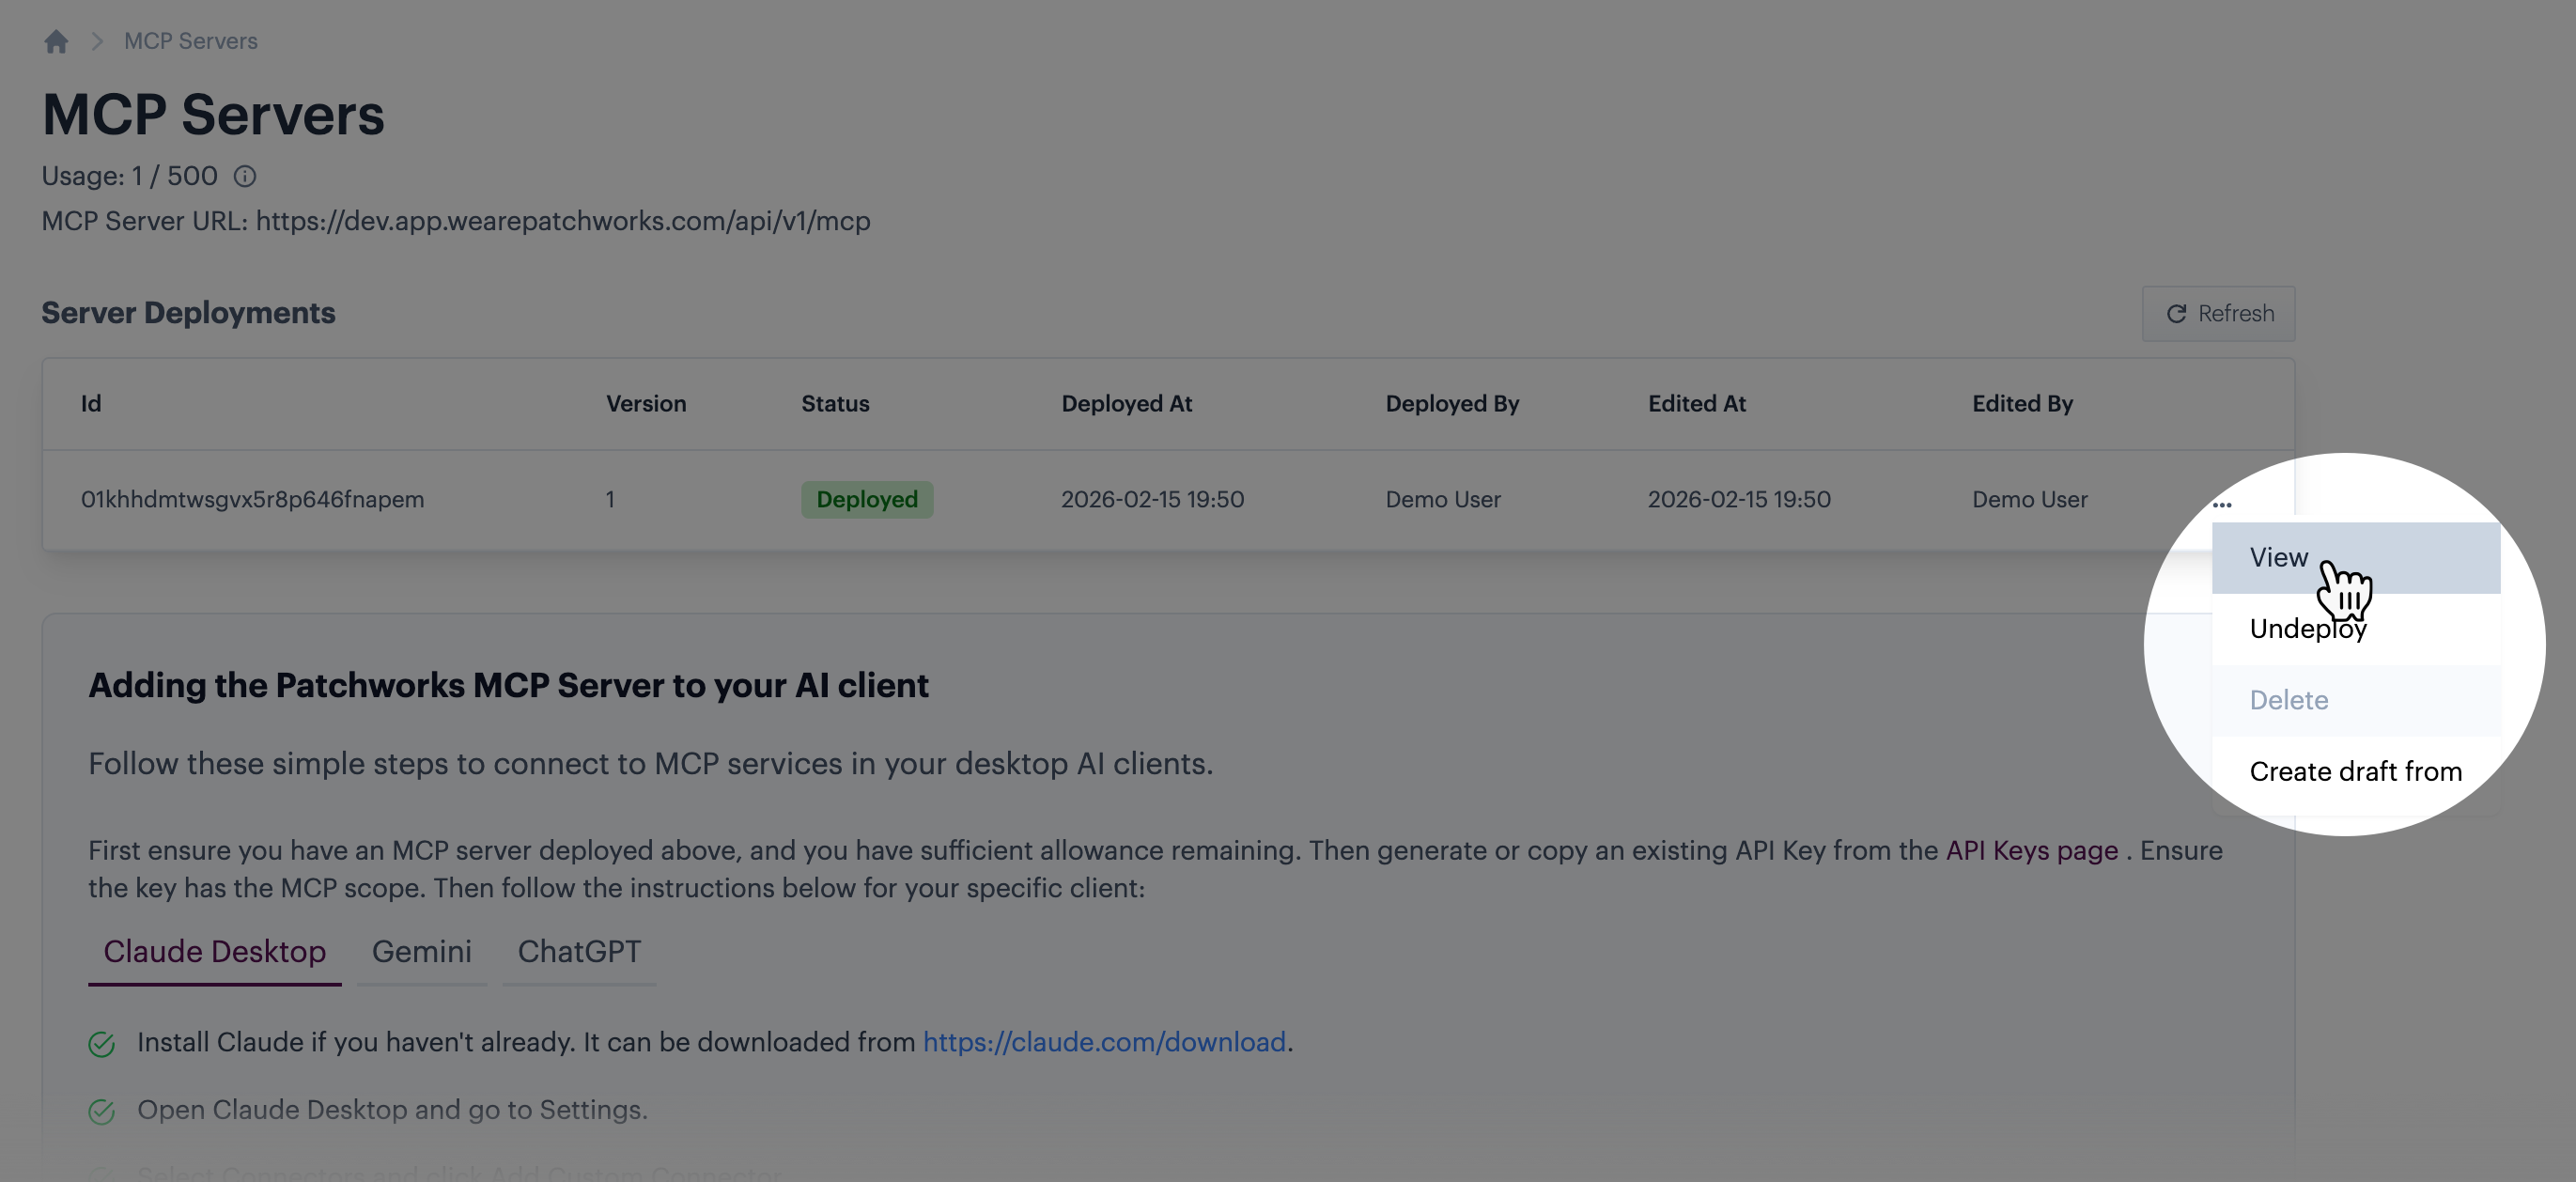
Select the view option:
Details for this deployment are shown:
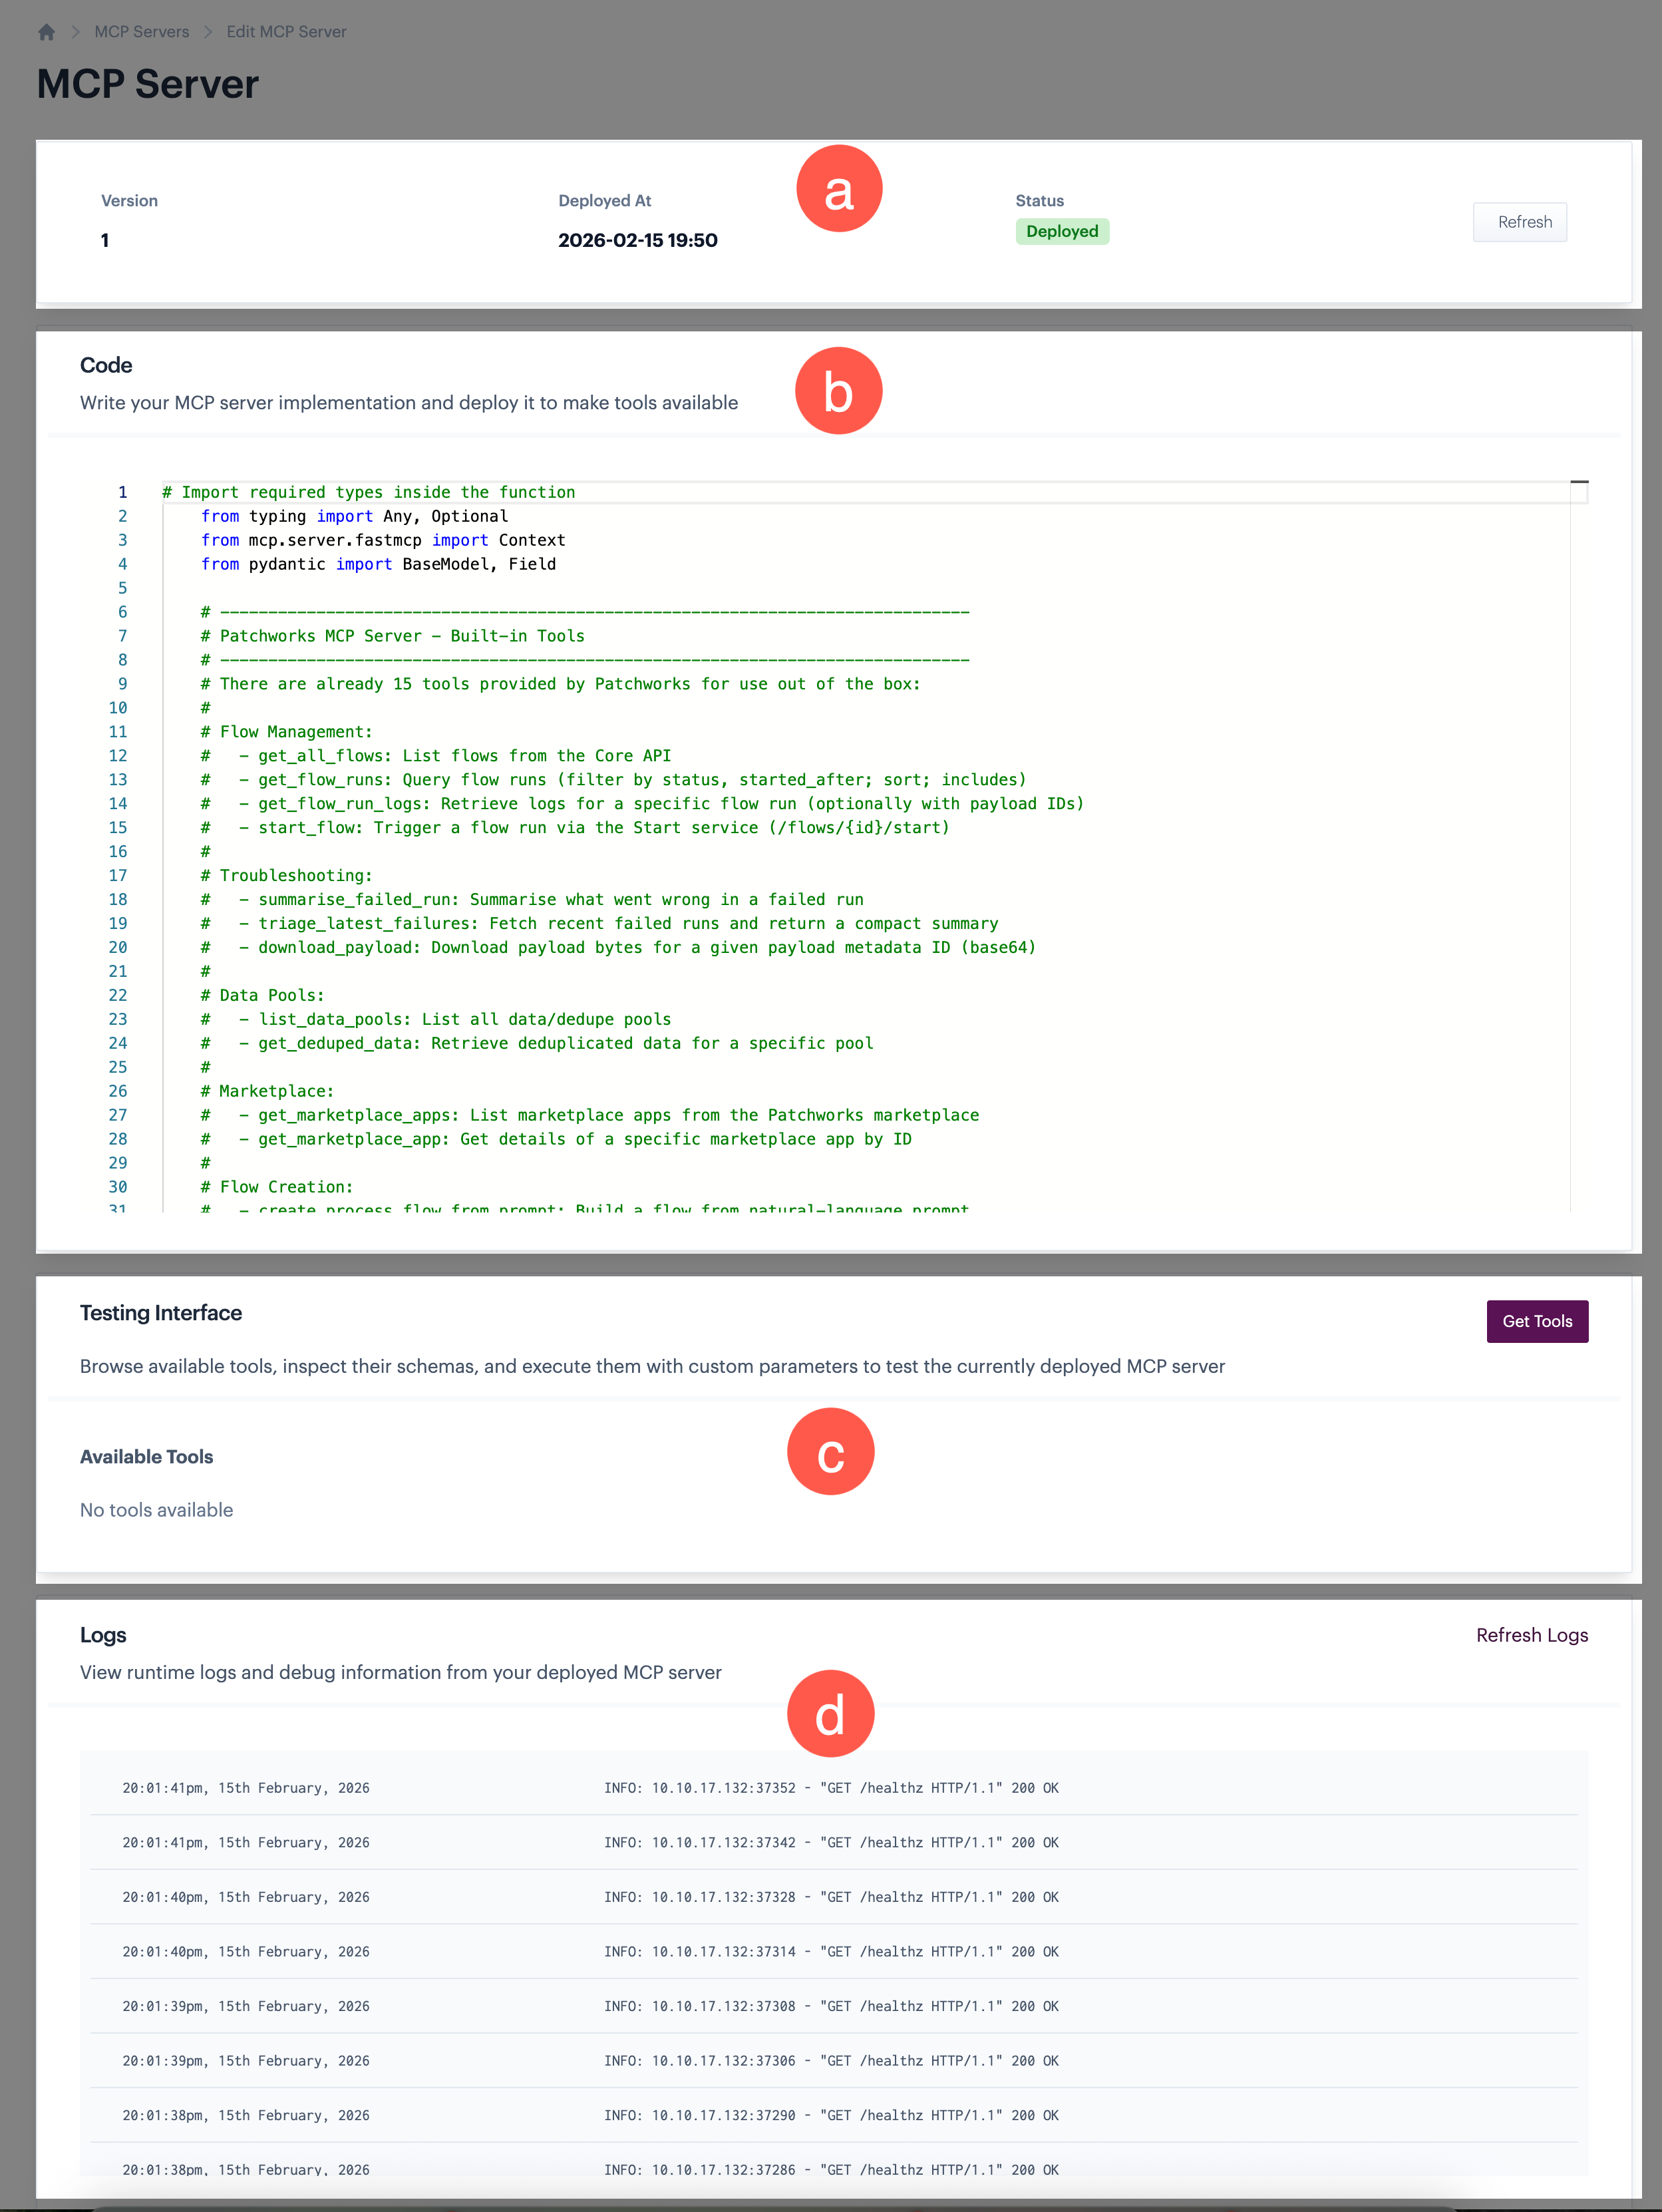
Information is available in four panels:
| Marker | Summary |
|---|---|
| a | Basic details for the selected server deployment. |
| b | The code panel shows the existing code for this server deployment. This is read-only, so you can't make changes here. If you want to update these tools, you need to do so from a draft - for details, please refer to Customising tools for your hosted MCP server. |
| c | The testing panel is used to list and test all tools associated with this deployment. See next steps for more on this. |
| d | The logs panel shows events for this MCP server. |
{% endstep %}
{% step %} Retrieve current tools
Click the get tools button:
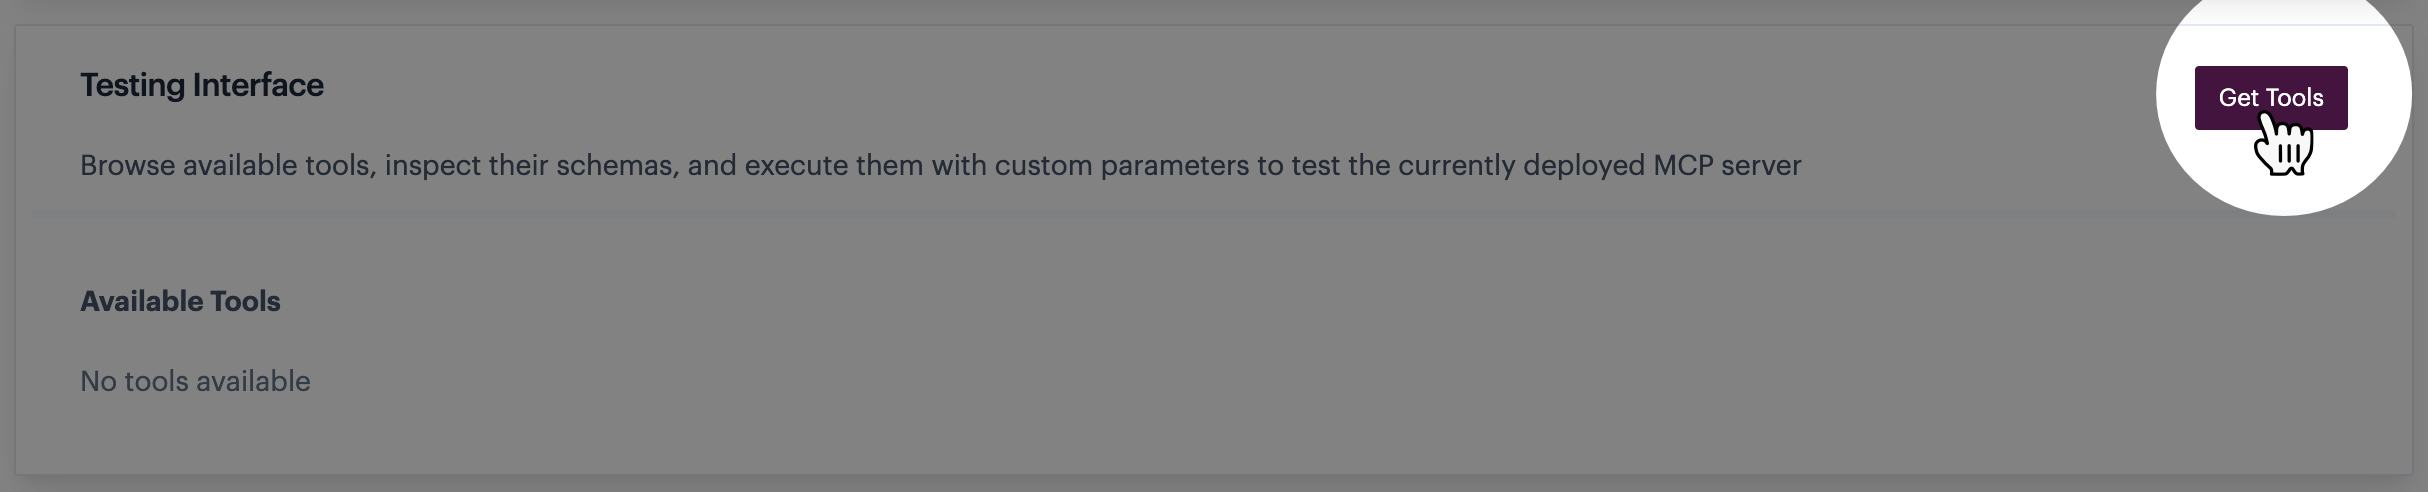
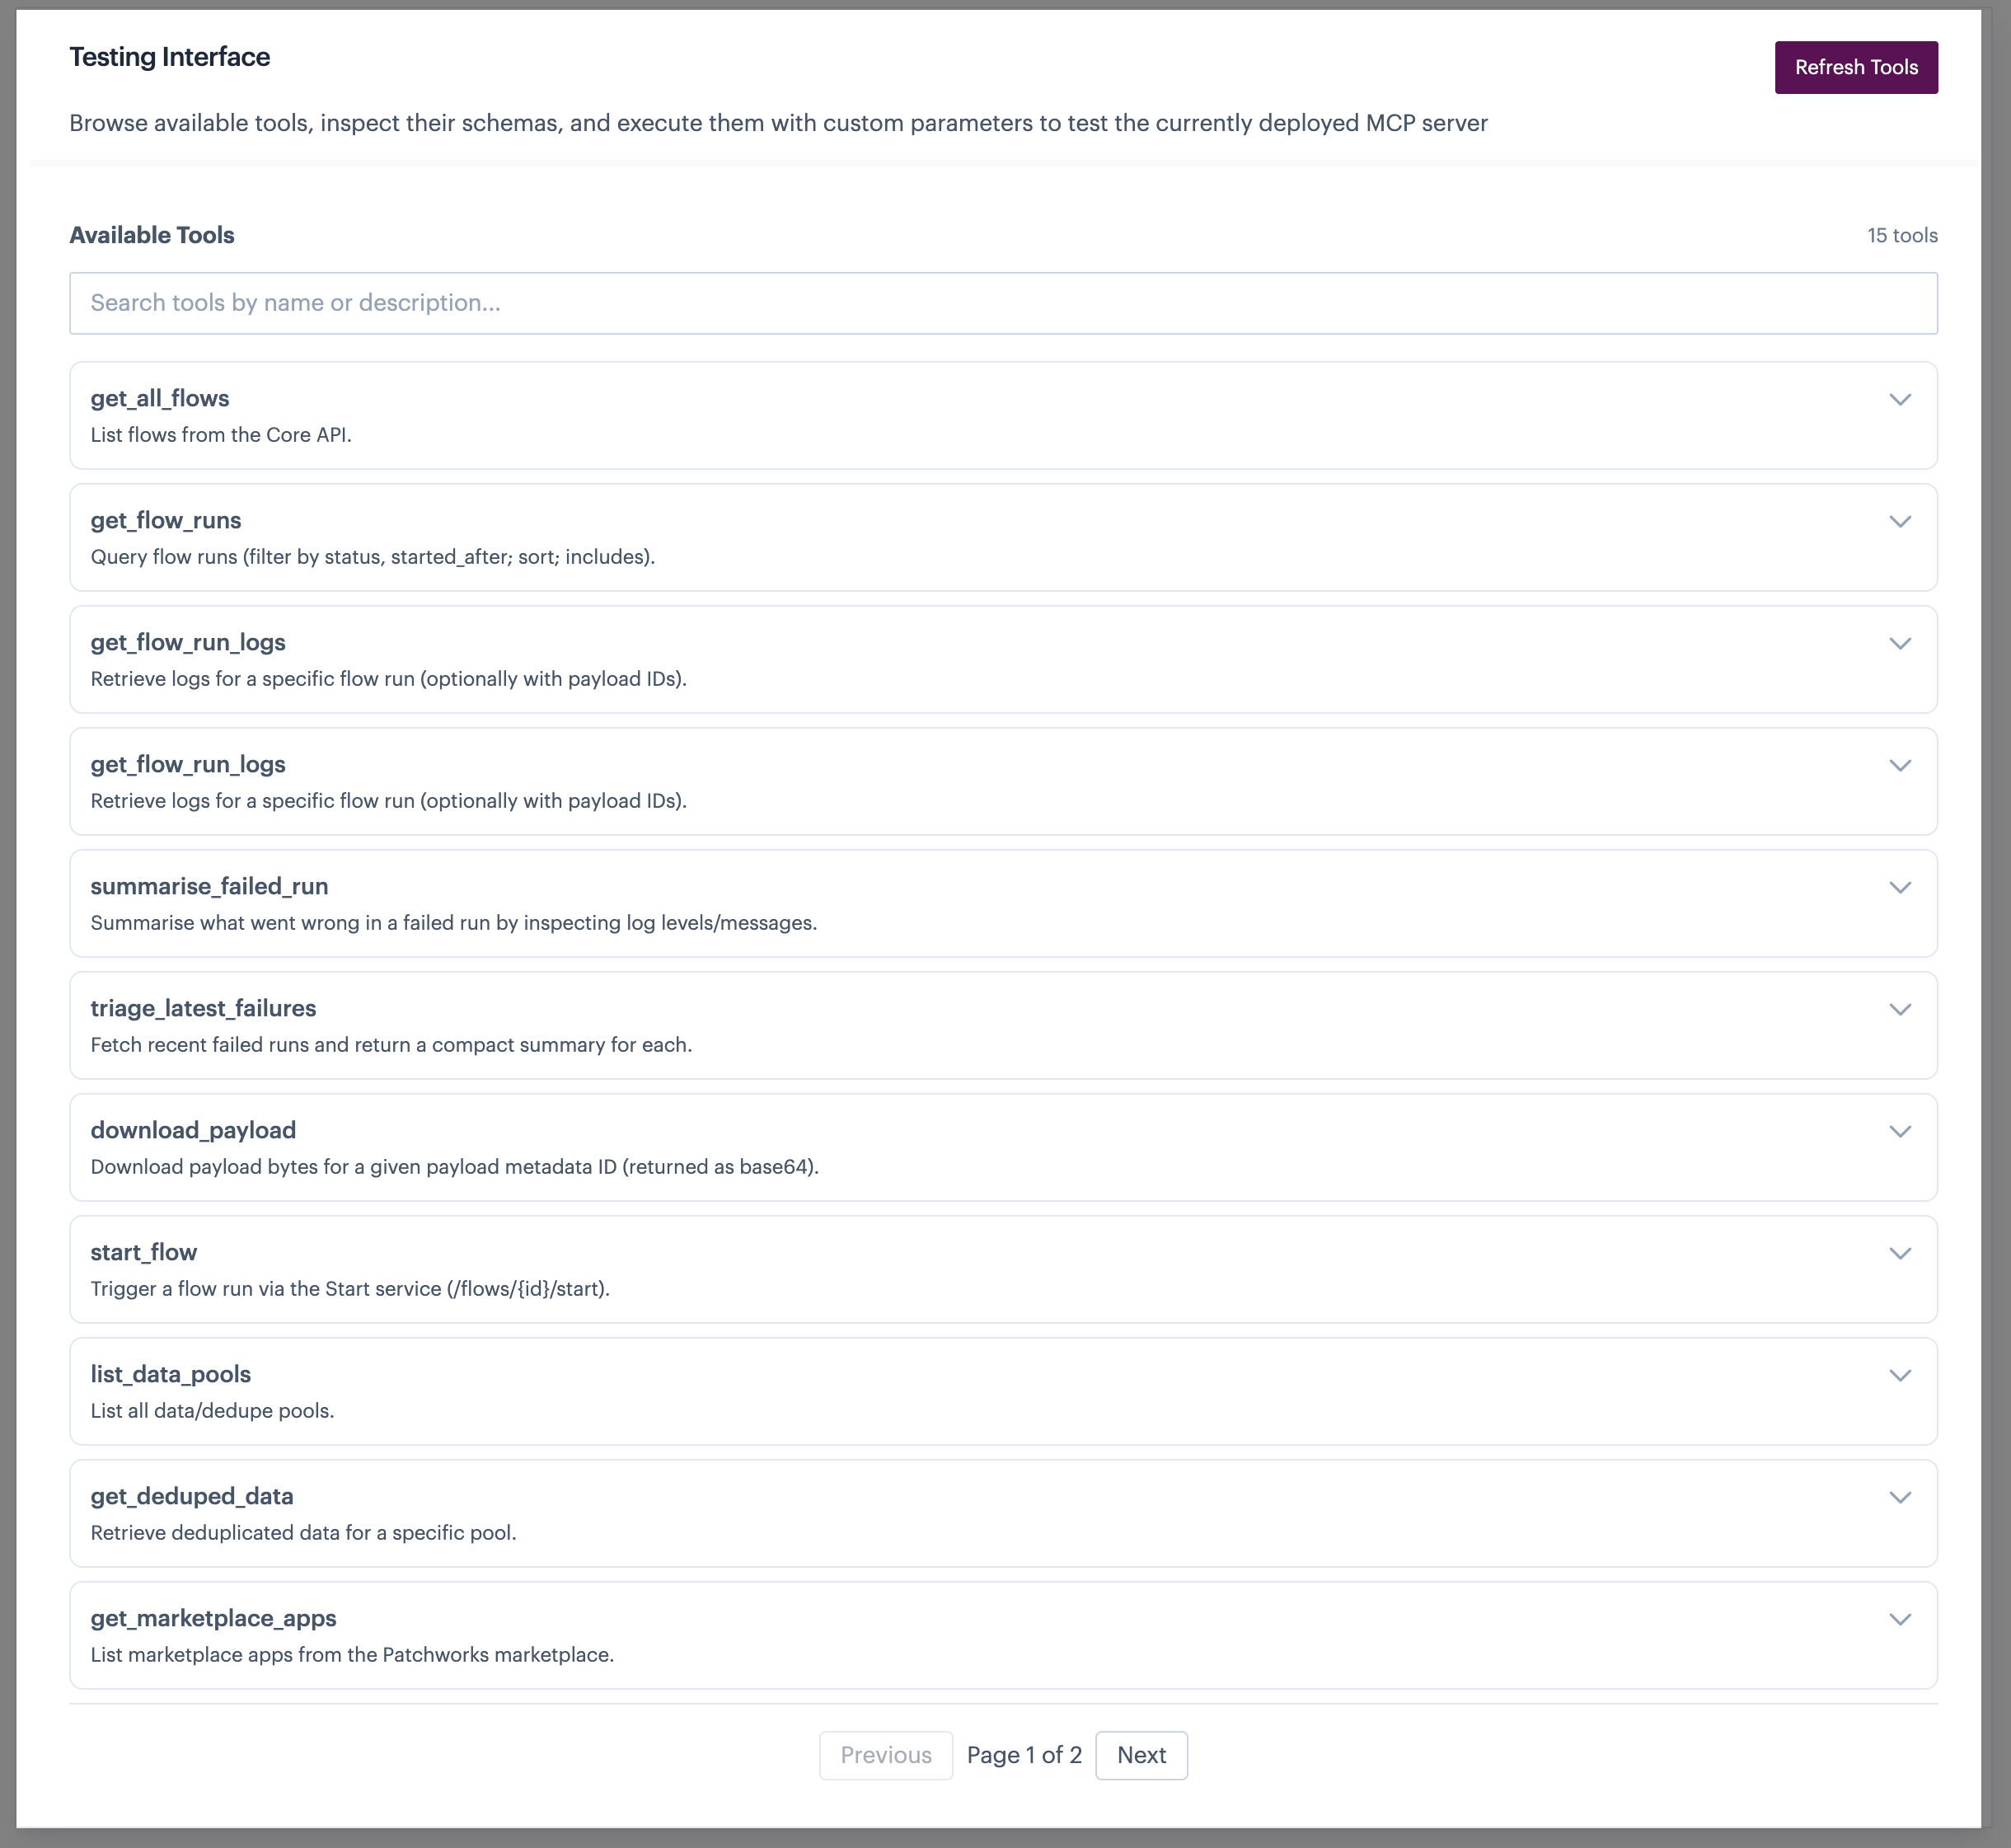
All existing tools are displayed. For example:
{% endstep %}
{% step %} Show details for the required tool
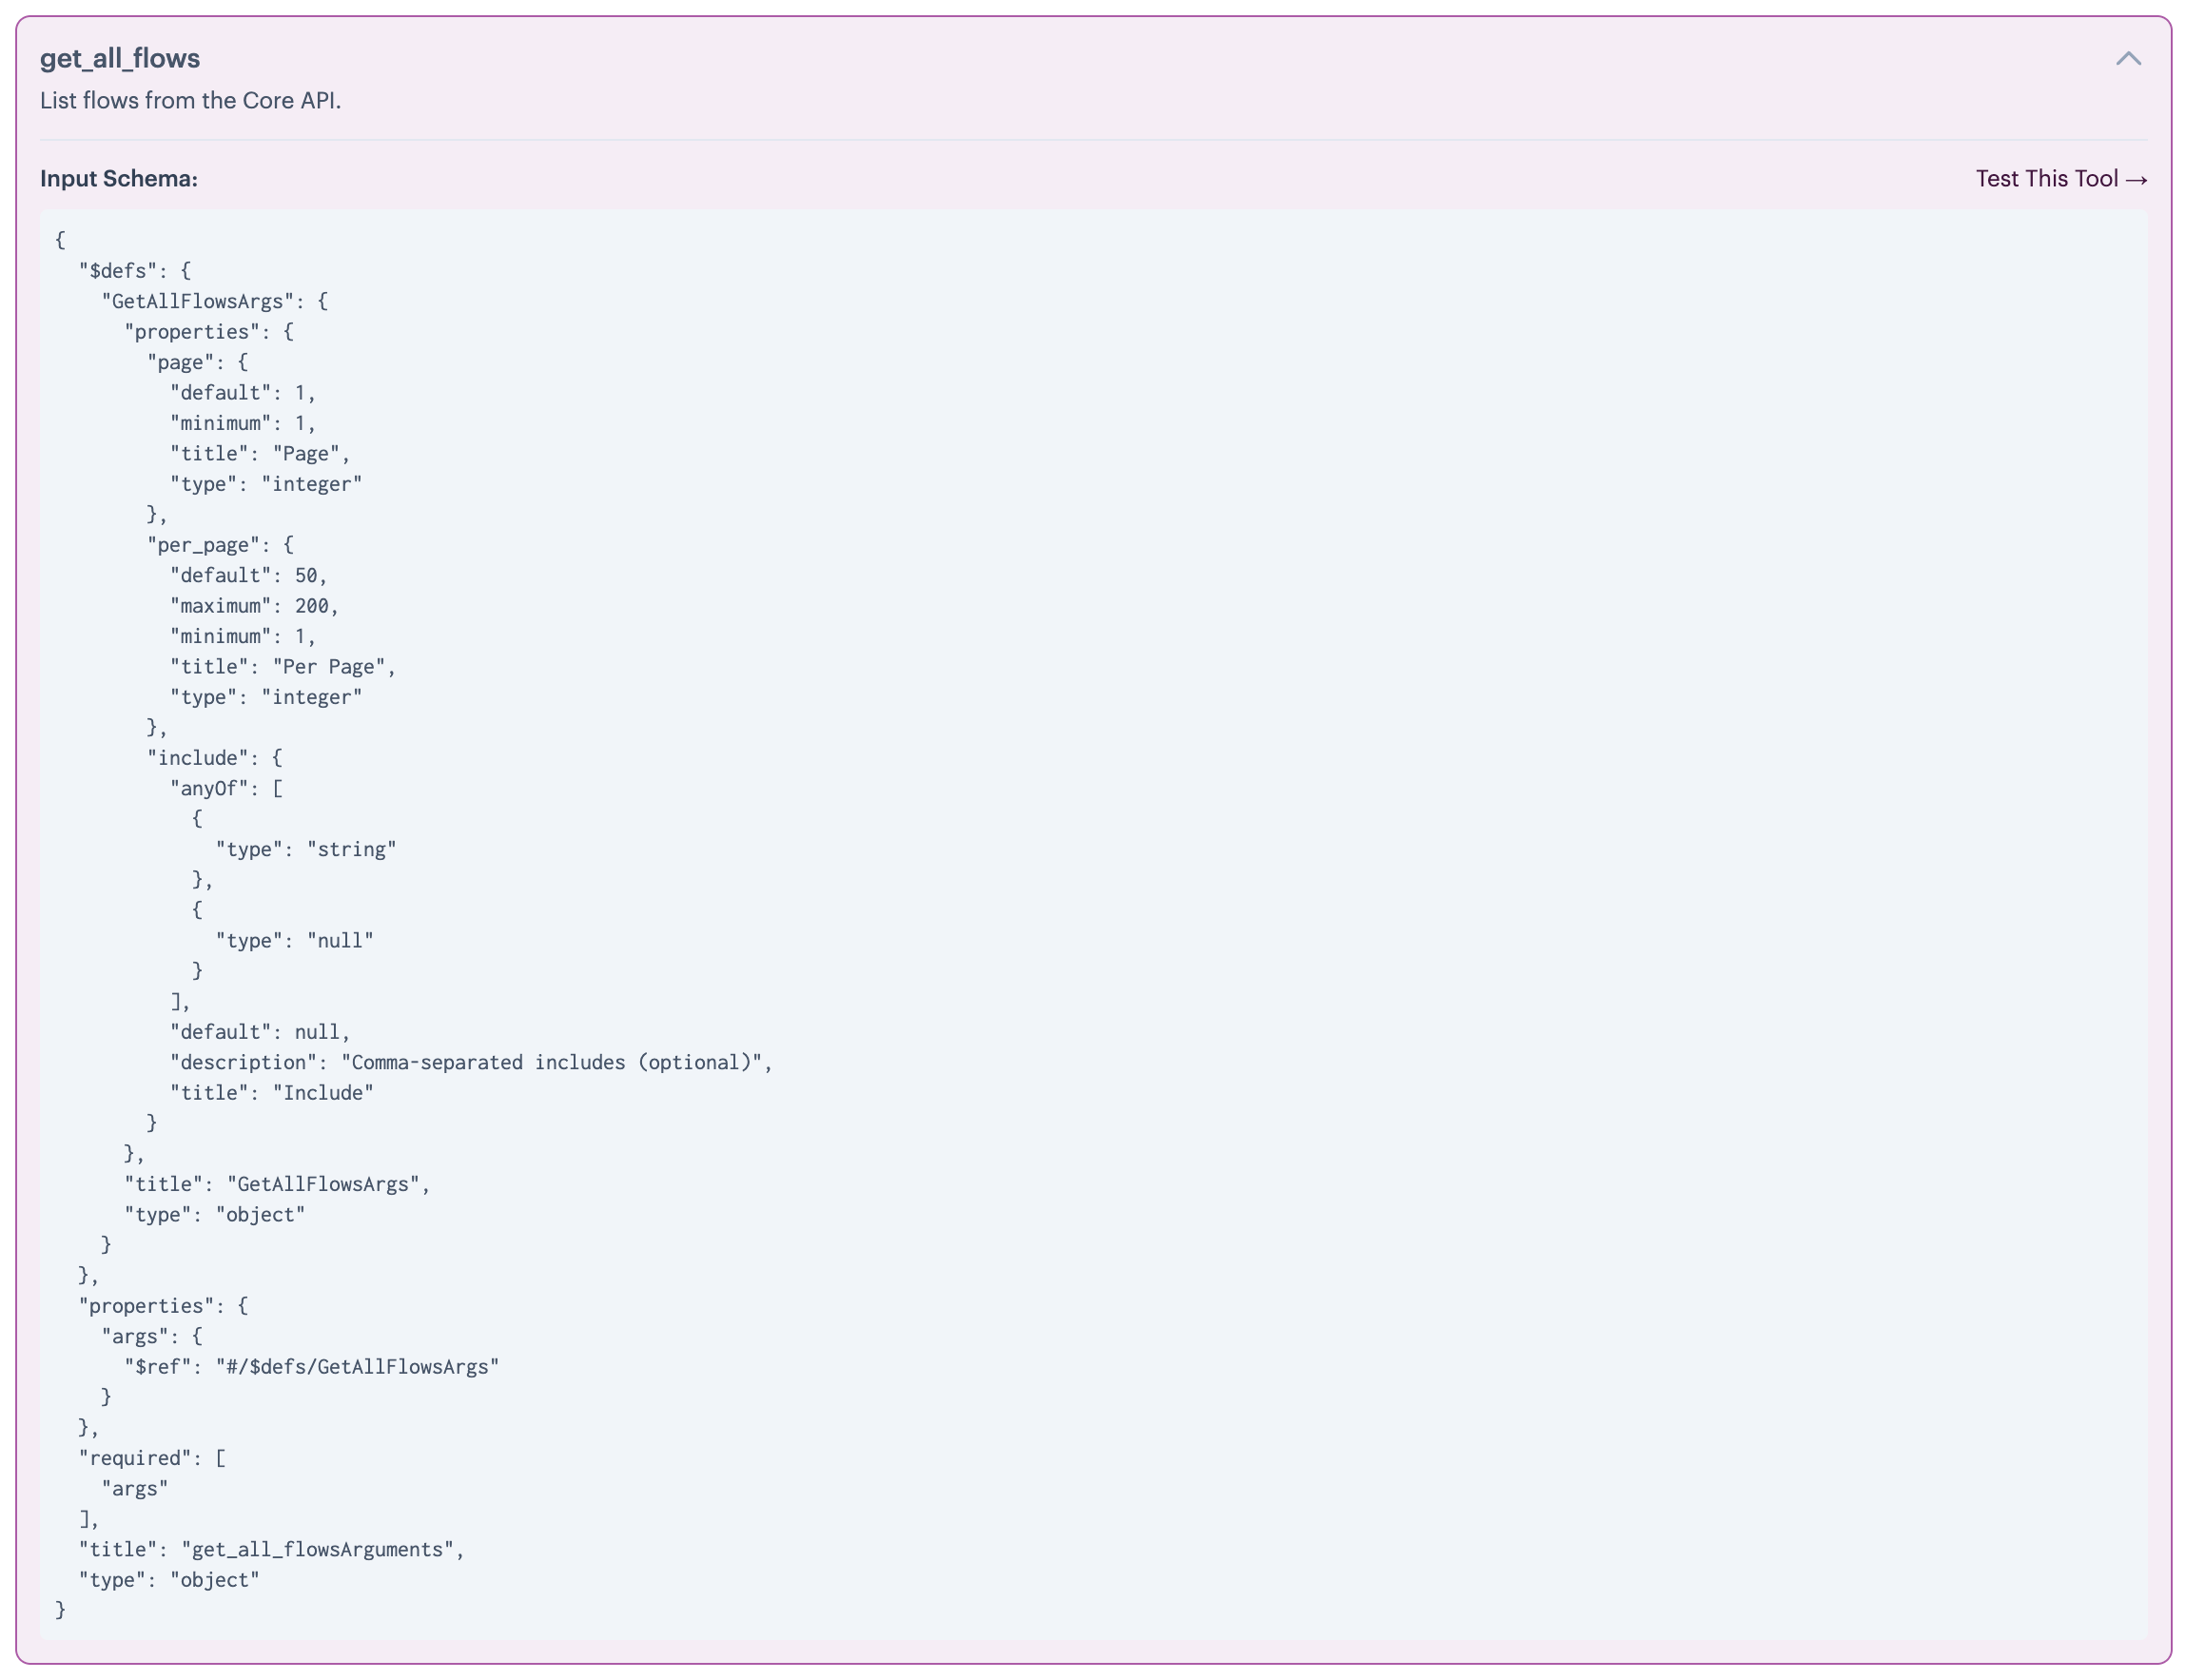
Click the arrow associated with the tool you want to inspect and/or run. For example:
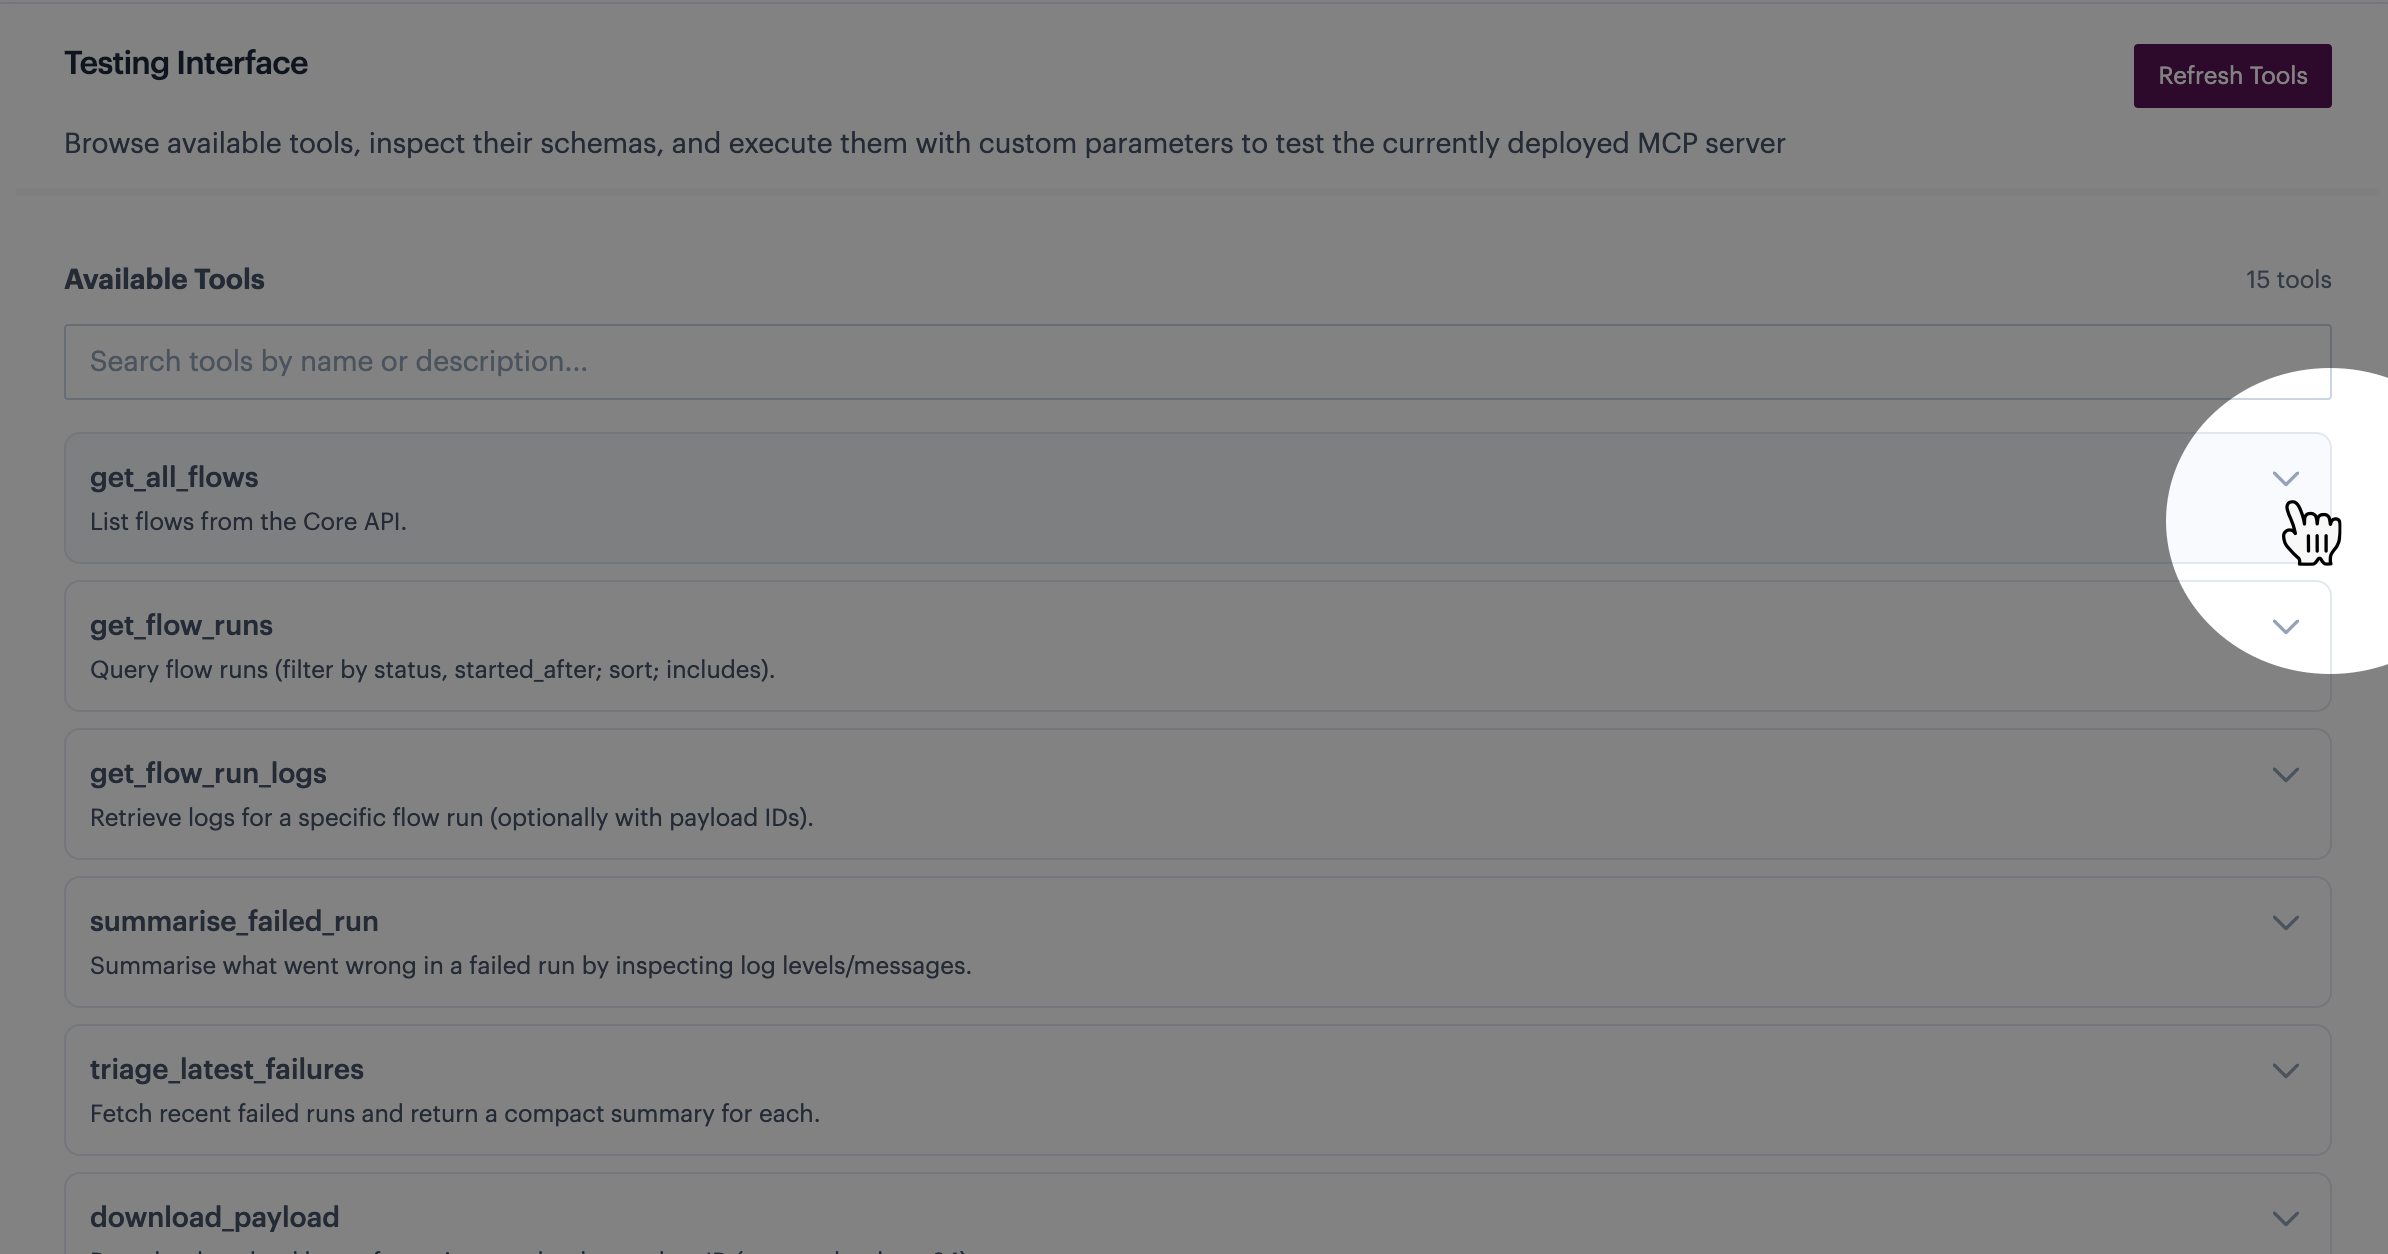
The tool schema is displayed. For example:
{% endstep %}
{% step %} Run the tool
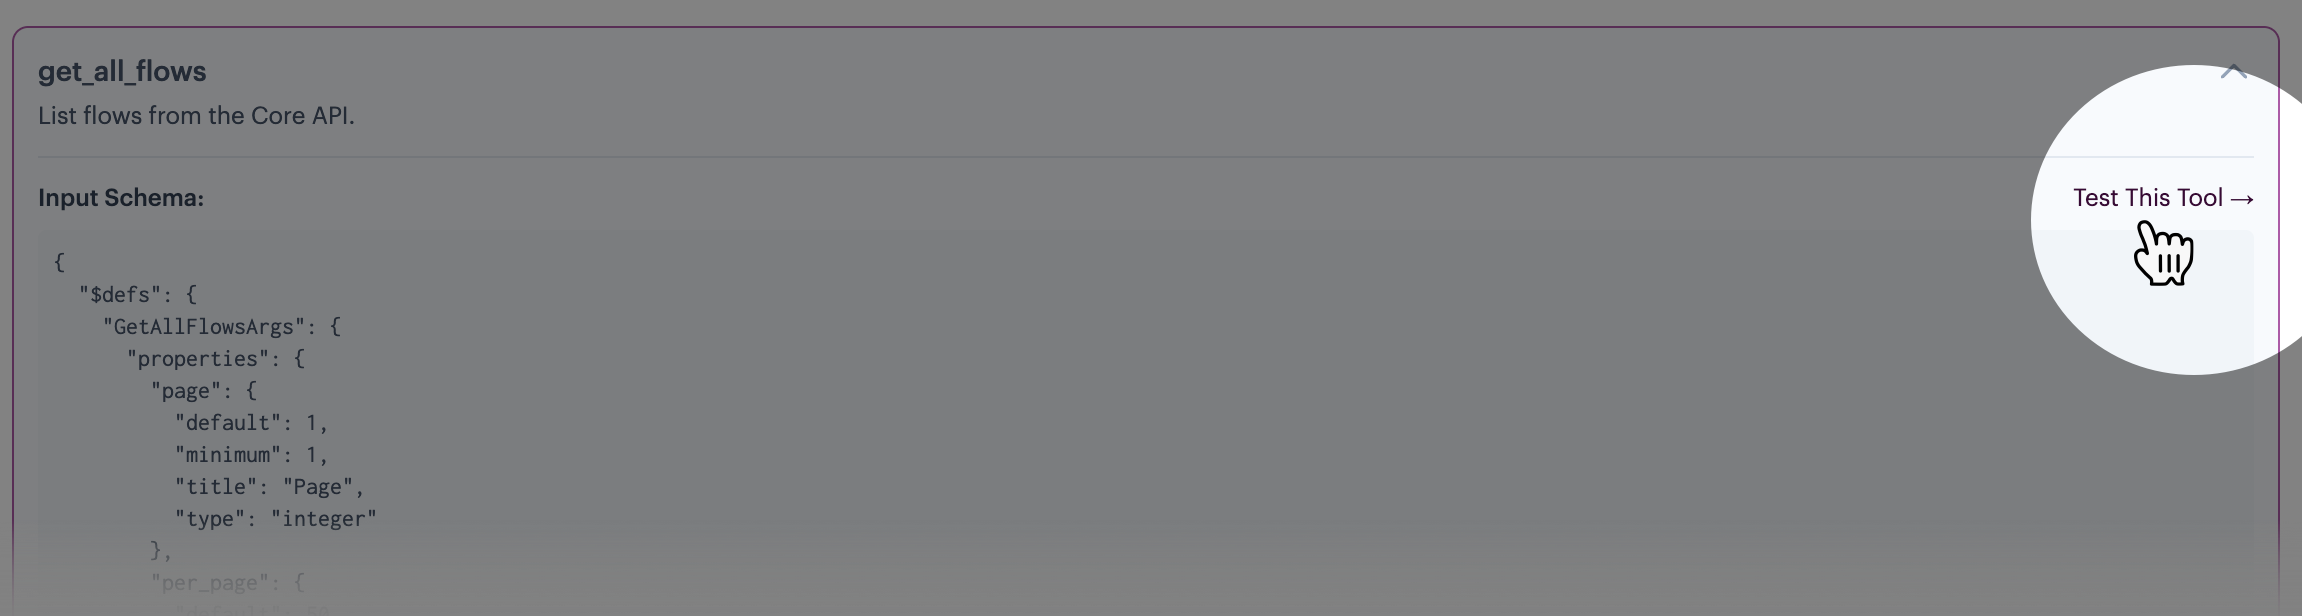
Click the test this tool option (at the top of the schema). For example:
Any parameters associated with the tool are displayed - you can update these as needed:
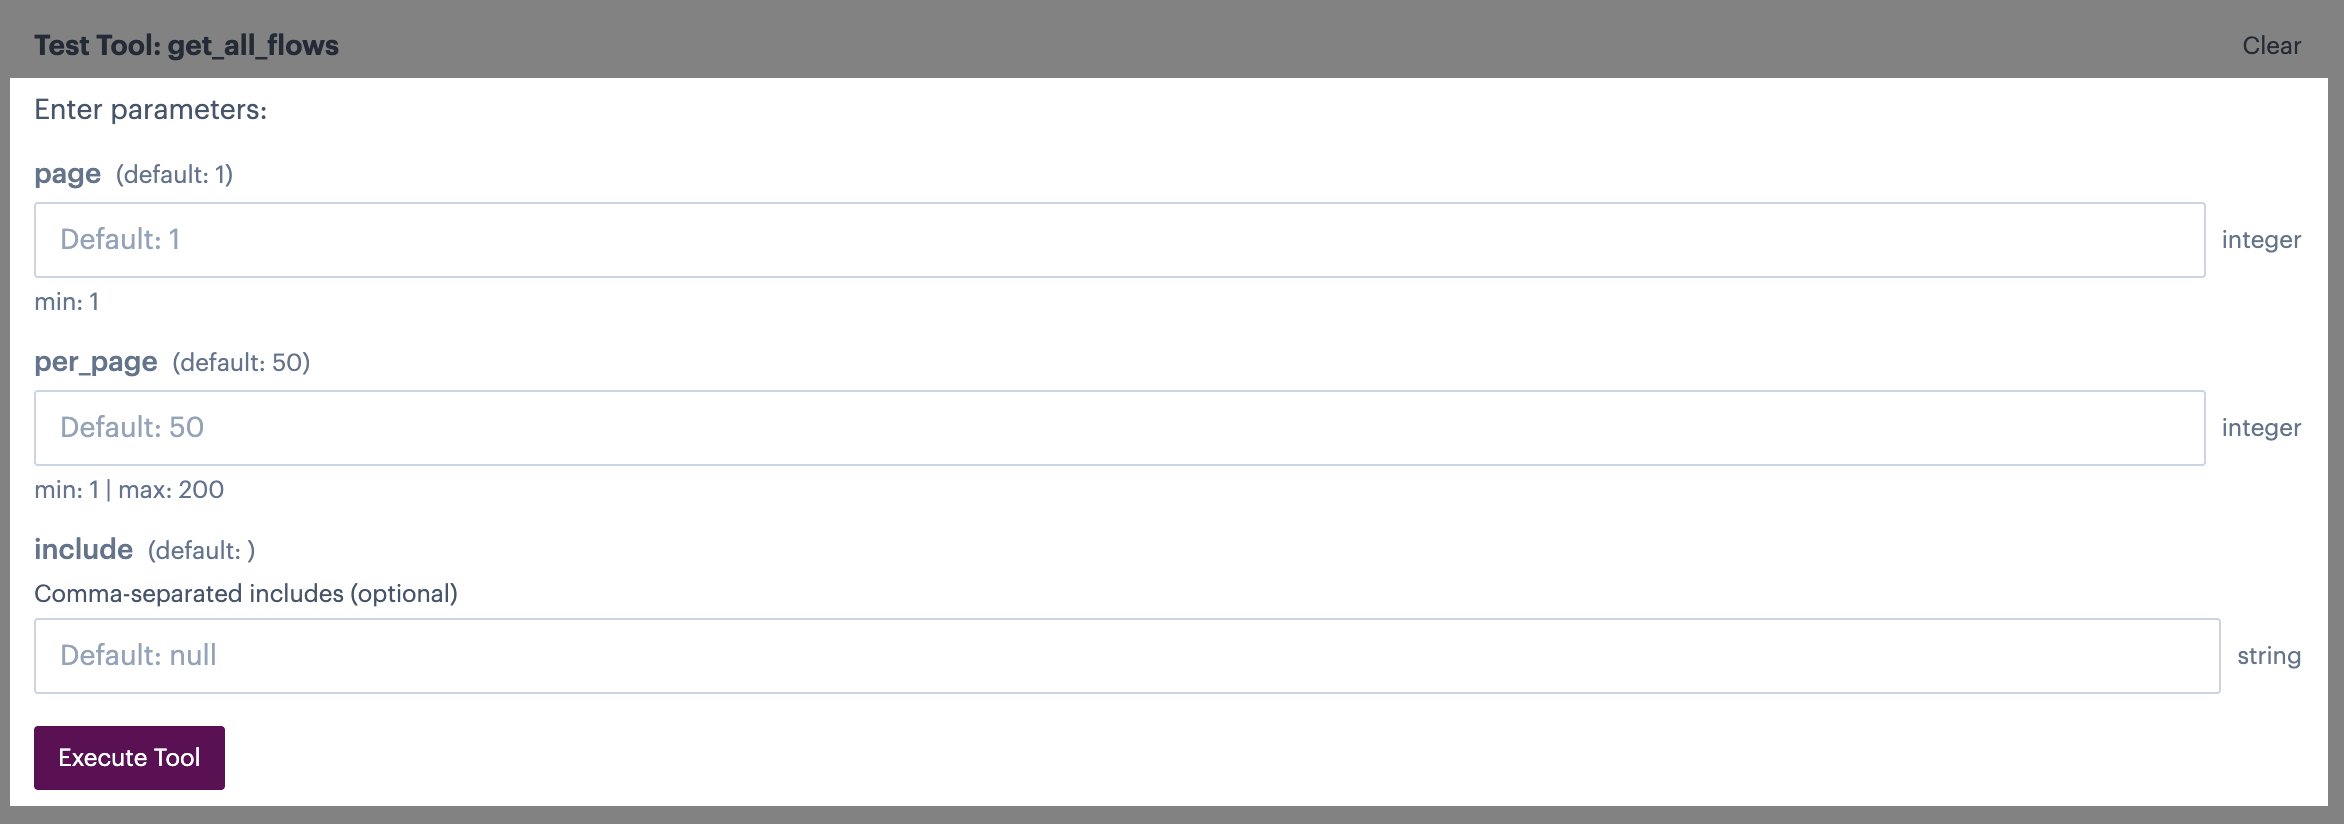
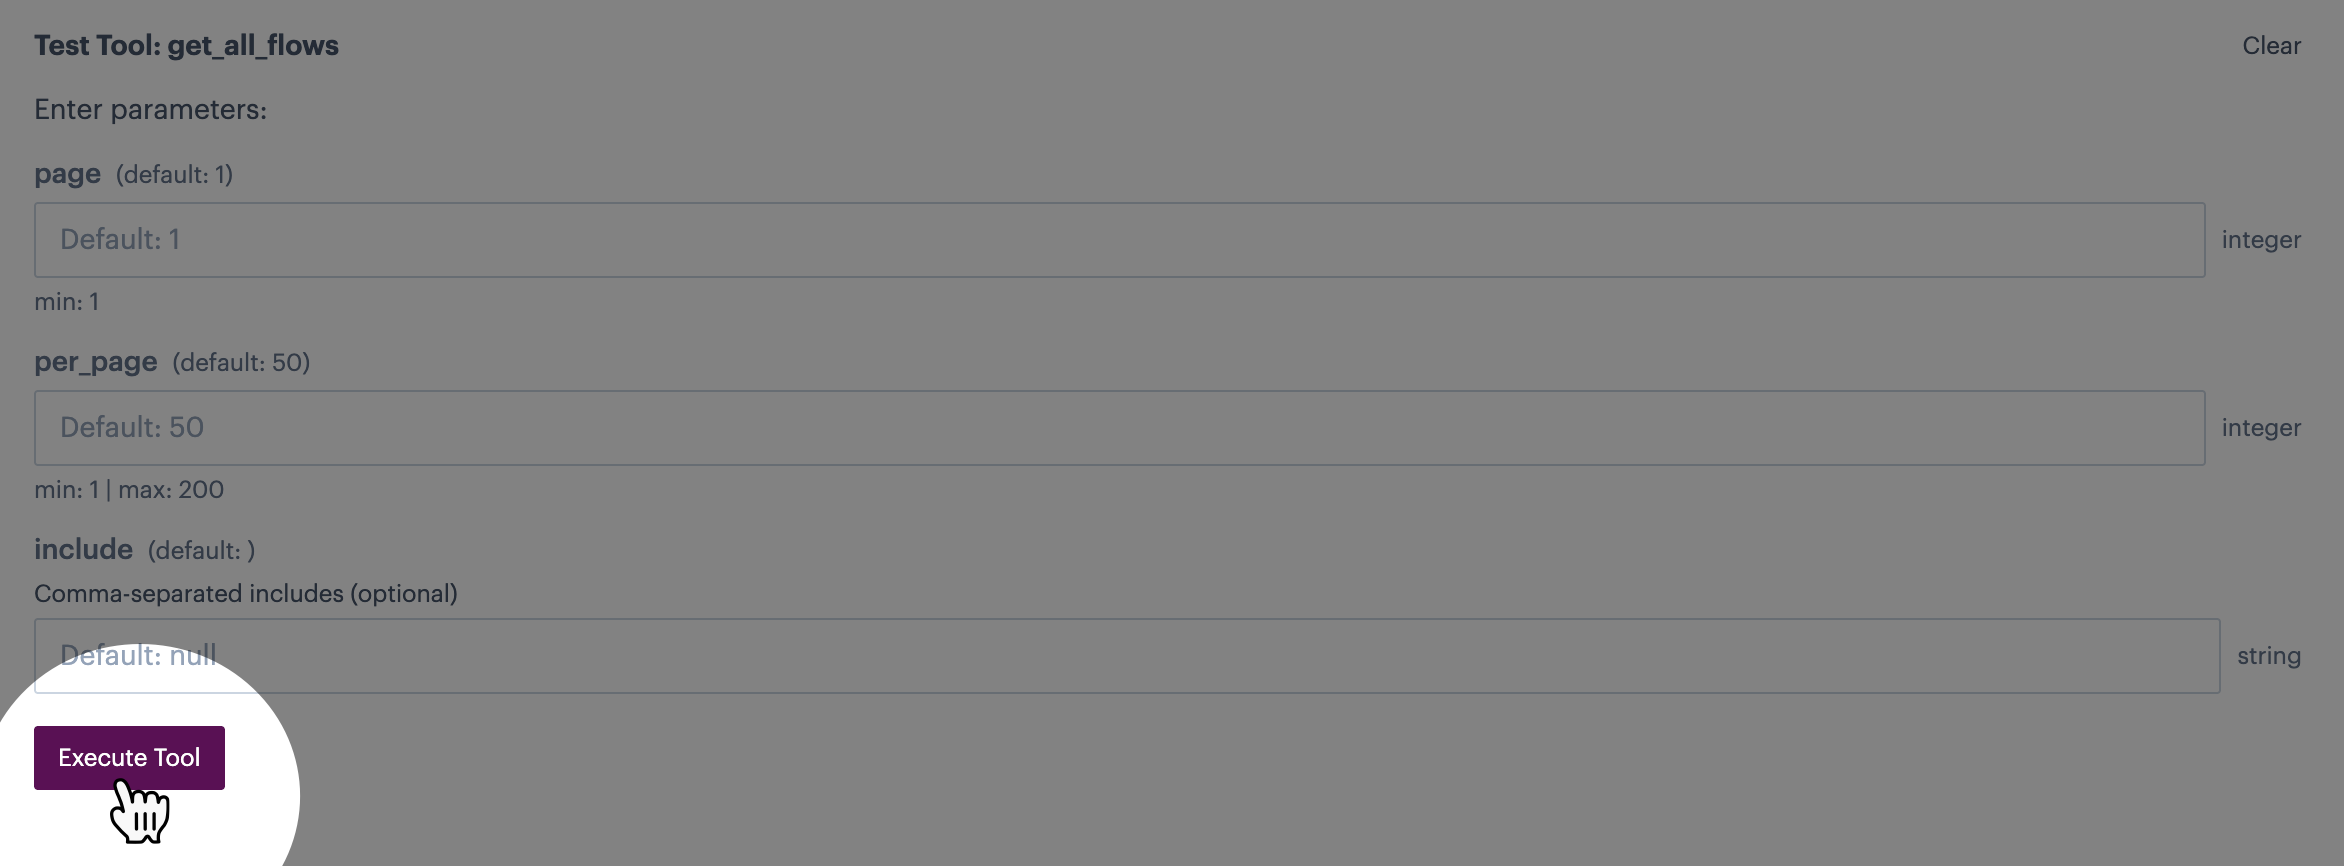
Click the execute tool button:
{% endstep %}
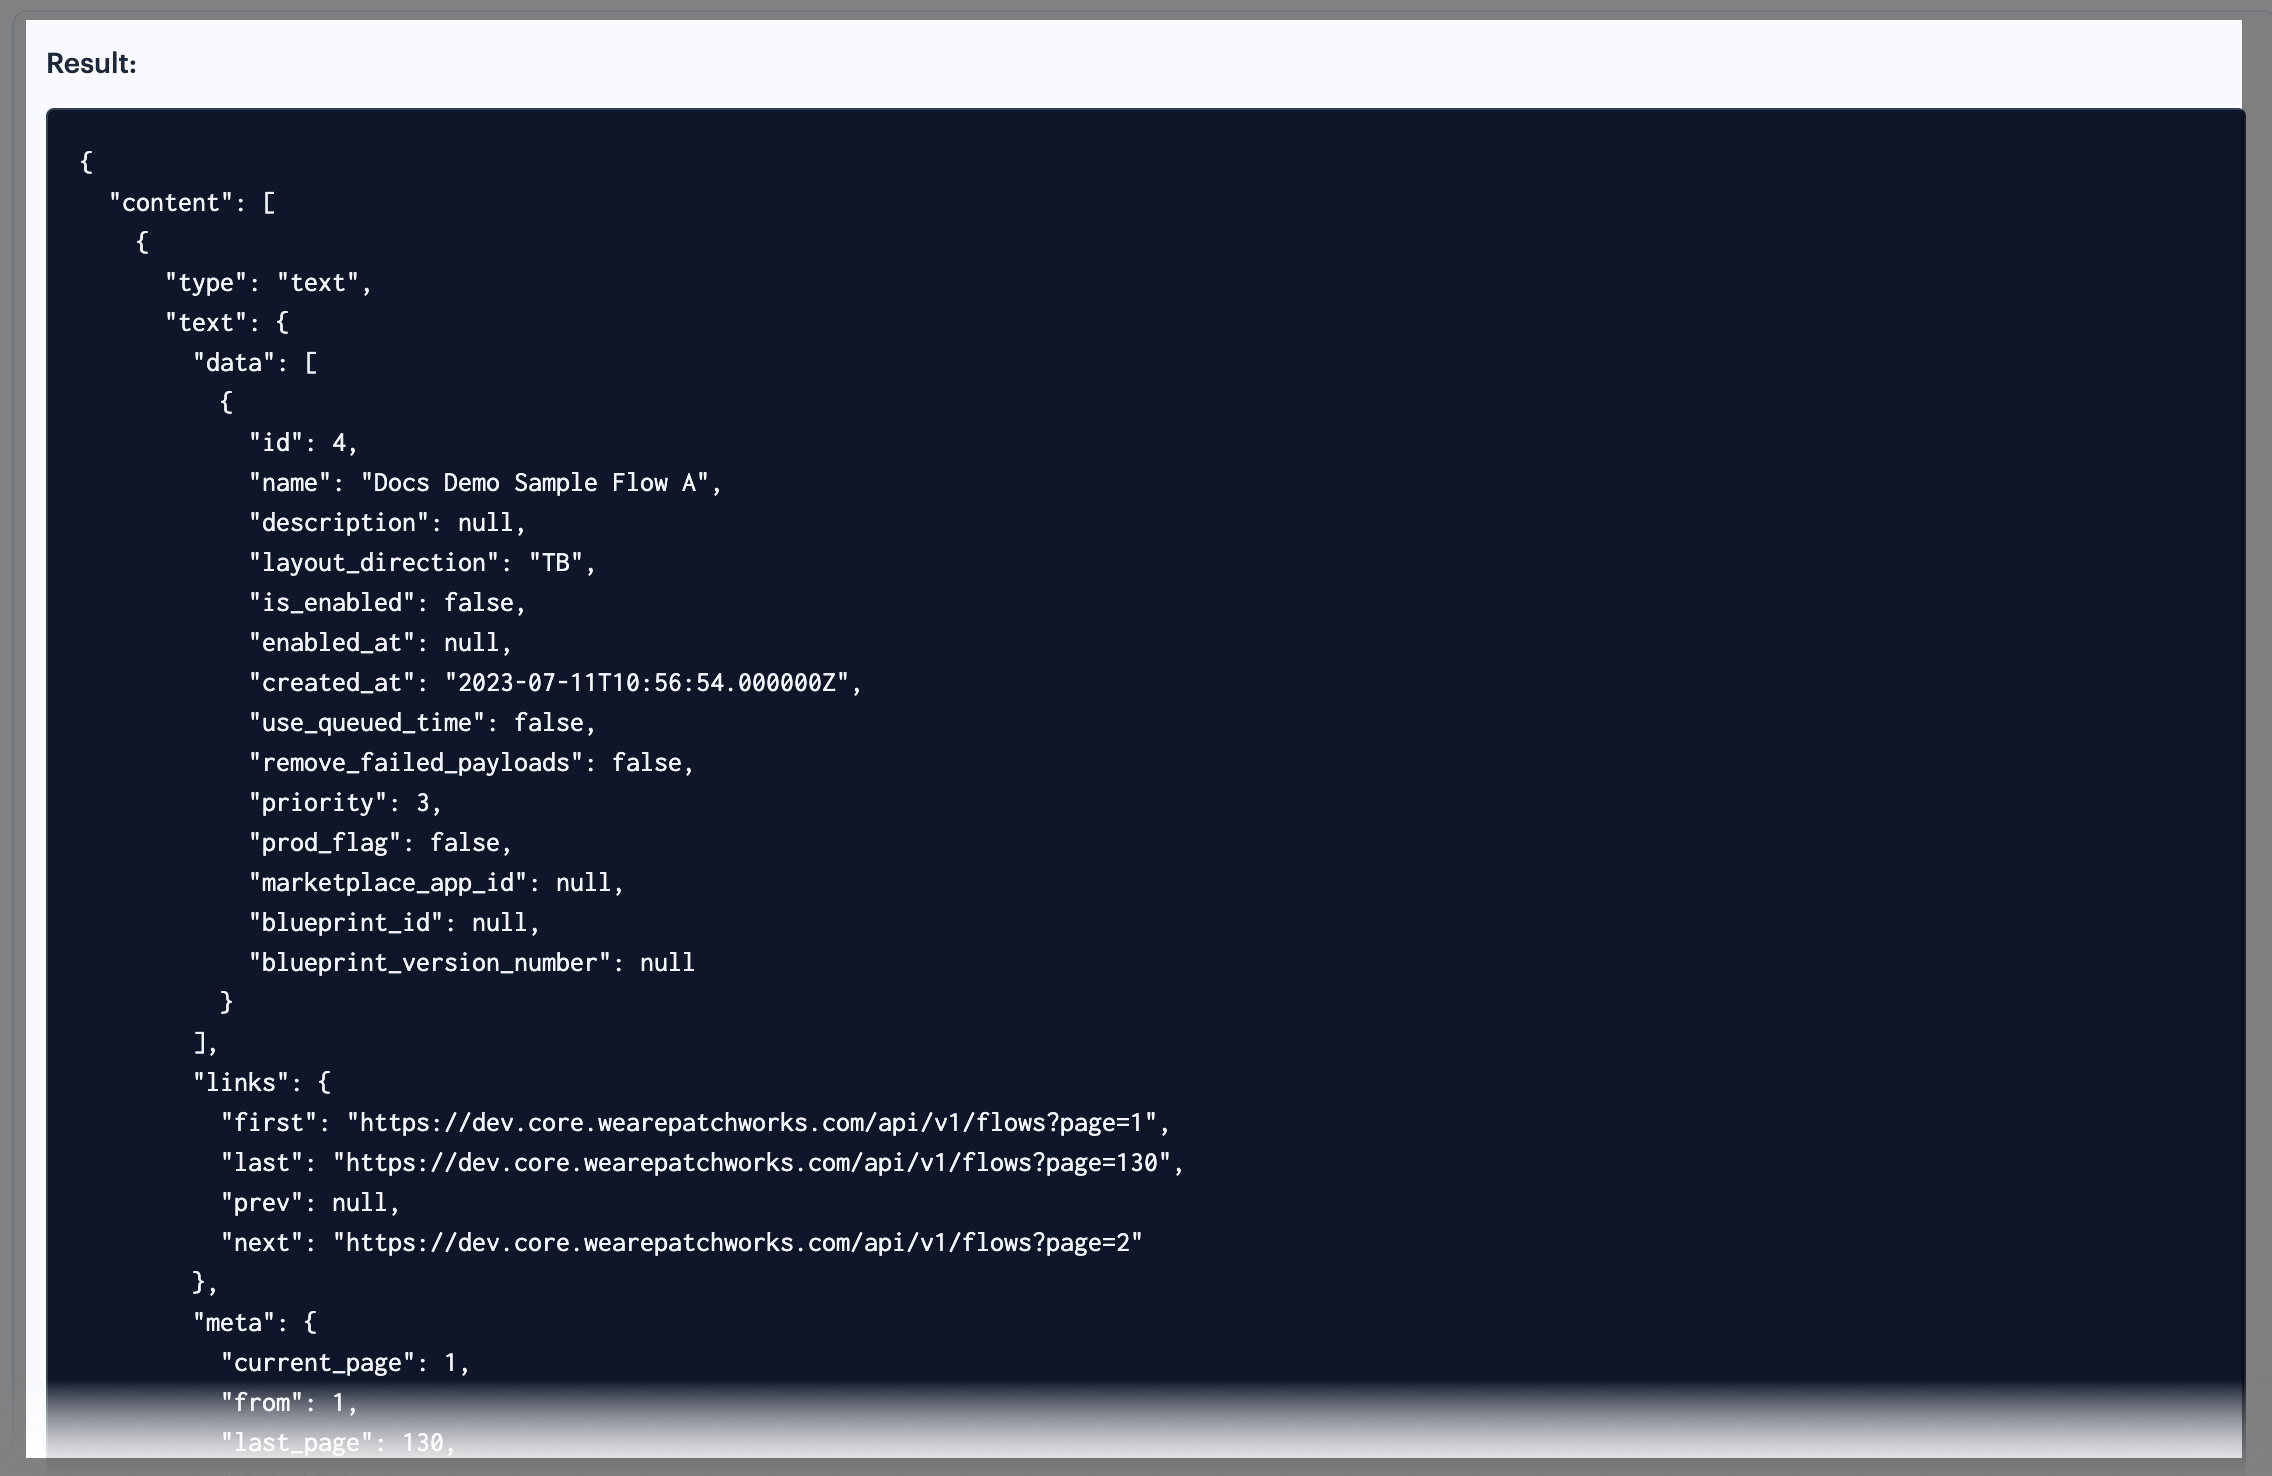
{% step %} Review results
Check the results panel for the request output. For example:
{% endstep %} {% endstepper %}
Comments
0 comments
Please sign in to leave a comment.